Driving Momentum With Data That Delivers
Step 6 of Transforming a Place Without Money or Authority
This newsletter is part 7 of a series on our seven-step placemaking process (what we like to call “how to get things done without a lot of money or authority”). If you missed the last part to this series, you can check it out here!

Data is a lever to make change. It’s a communication tool.
All people, depending on their roles and responsibilities, value different types of communication. Using data to measure, evaluate, and talk about your project’s impact can validate what feels intuitively good, reveal what’s working, and help you build momentum for future efforts.
You can think of data as another way of meeting people where they are, as some stakeholders need to see numbers to understand what you’re accomplishing. In particular, entities such as funders, partners, and decision-makers typically don’t directly experience the place, yet still hold authority over the things that happen there. For them, data is a language of trust. It translates local experience into quantifiable evidence that your project is making a difference.
Data as a Communication Tool
Every placemaking effort has multiple audiences: the people using the space, the changemakers implementing improvements to it, and the authorities who can authorize or fund the next step. Data is a communication tool that works across all of these layers.
There are two broad kinds of data to collect:
Data that helps you improve your placemaking efforts — the kind that shows what’s working and what isn’t, allowing you to refine your approach in real time.
Data that proves your impact — the kind that demonstrates results to others, substantiating the case for continued investment and expansion.
Both are essential. The first builds stronger projects; the second builds stronger constituencies.
Choosing What to Measure
Before you begin collecting information, clarify what questions matter most. What data will tell you if your goals are being met? What evidence will be meaningful to stakeholders and future supporters — to their goals? Ideally, your data should connect your project’s human outcomes (feelings of safety, belonging, and joy) to tangible metrics that can be tracked over time.
For example, you might measure:
Usage counts: How many people visit the space each day or periodically during specific events, before and after the project. This is usually the most important baseline data point to collect, and is relatively easy to do in a contained site with onsite staffing. At a district level, you can get usage counts using tools like placer.ai.
Demographics: Who is using the space and how that changes. (For instance, an increase in non-male users often indicates a perception of greater safety.)
Survey responses: How people describe their experiences. For instance, with our Central Station project, we collected data about people’s perceptions of safety, the impact of the site’s improvements on their experience living and working downtown, and whether or not they told someone about the positive experience they had there. This feedback from people who directly experience the place ties into, leverages, and builds off of past engagement and communication efforts.
Behavioral outcomes: Increases in merchant sales, slower traffic speeds, lease rates, or new neighborhood plans and projects passed following a demonstration event.
Media and narrative shifts: Views and mentions on social media or in local news that reflect a changing story about the space. You can use tools like Buffer for social media, or Critical Mention for PR — or even just your own compiling.
The Golden Logic Model
Each data point in isolation may only hint at a trend, but together, they paint a fuller picture of a place that’s improving and of people whose experiences are getting better. We refer to this as the golden logic model, where:
The space and experience has visibly improved,
Followed by increased usage counts, and
Coupled with data that ties back to your (or others’) core goals.
This is persuasive because the space improved, which enticed people to show up, and that activity contributed to core goals and other people’s constituencies. Creating these three links via data creates a lot of momentum and can persuade skeptics.
How to Collect Data
Data collection doesn’t have to be complicated or expensive, as many effective methods can be done with basic tools and planning.
Usage counts, for instance, can be recorded with simple observation: note how people use the space at different times of day, week, or season. A smartphone or inexpensive time-lapse camera can capture use patterns even when you’re not physically present. Online forms or brief in-person interviews work well for conducting surveys, and local agencies or organizations will likely have data you can tap into to find traffic counts, safety reports, or retail sales data.
Just remember to start early. Collect baseline data before any changes begin, so you can show how conditions have improved.
Turning Feelings into Evidence
One of the hardest parts of data collection is translating qualitative impressions (“I feel safer here” or “This space makes me happy”) into measurable terms. Surveys can help bridge that gap, but behaviors often tell the clearest story. Higher attendance, more vendors, slower cars, longer dwell times — these are all signs that people’s experiences are improving, even if they can’t fully articulate why.
Testimonials, especially from recognizable community members or stakeholders, also count as data. When paired with behavioral and numerical evidence, they reinforce the same narrative from multiple angles, making your findings more persuasive.
Data Builds Momentum
When shared effectively, data doesn’t just validate your current work: it fuels future possibilities. Demonstrating measurable success strengthens your credibility with funders, helps overcome skepticism, and can inspire others to replicate or support your approach. In this way, data can transform a single successful project into a model others can rally behind.
At The Musicant Group, we’ve seen this dynamic firsthand. Let’s look at a couple of examples.

The Capella Tower
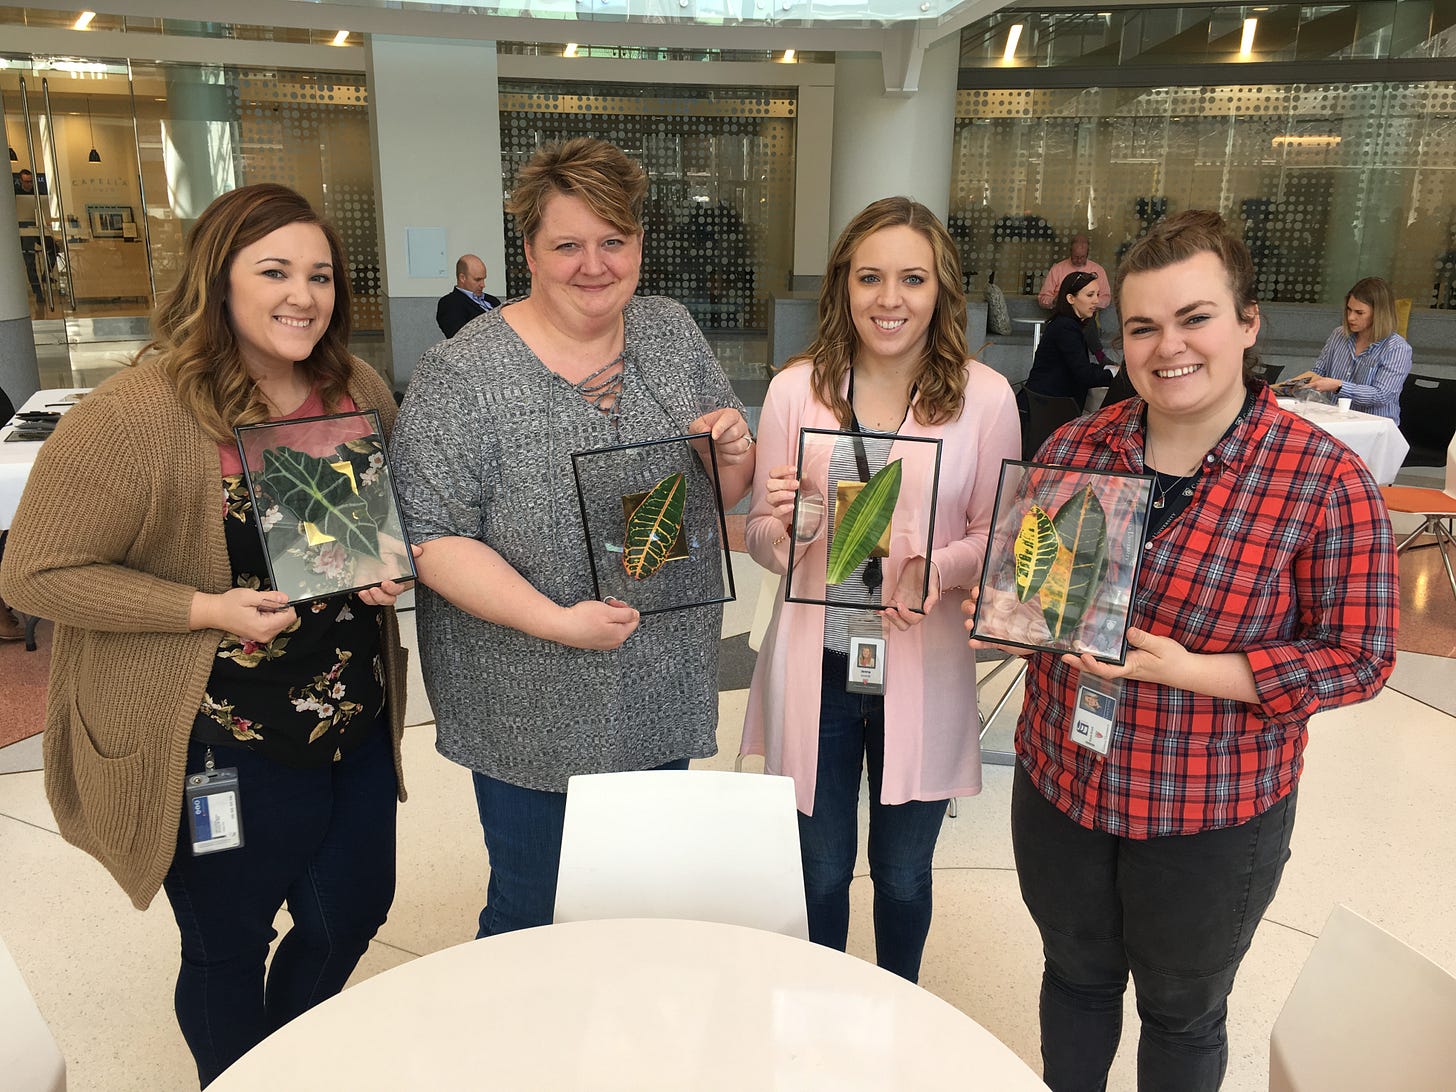
We were hired by this 1,200,000-square-foot office building’s owners to increase leasing activity by programming and managing its then-underused common areas. We helped them line up over 250 events a year, create a new internal communications system, and collaborate with tenants on achieving HR goals, among other efforts. After implementing changes, we surveyed the tenants and found that:
48% were more interested in coming into the office,
37% were more likely to stay at their current company, all things being equal (and 0% were less likely to stay at their company),
78% felt an increase in their sense of community and connection within their organization, and the building as a whole, and
94% of the tenants reported feeling more satisfied with their tenancy.
This data told stakeholders that improvements to the building played a role in keeping employees around, and that made the building as a whole worth their continued investment. The building’s senior broker stated that:
“The Musicant Group’s social programming has been an essential ingredient to our leasing program. Their data collection and analysis of how their efforts improve an employer’s ability to attract and retain good employees is used extensively within our leasing efforts, with both new tenants and renewing tenants alike.”

Living Room Station
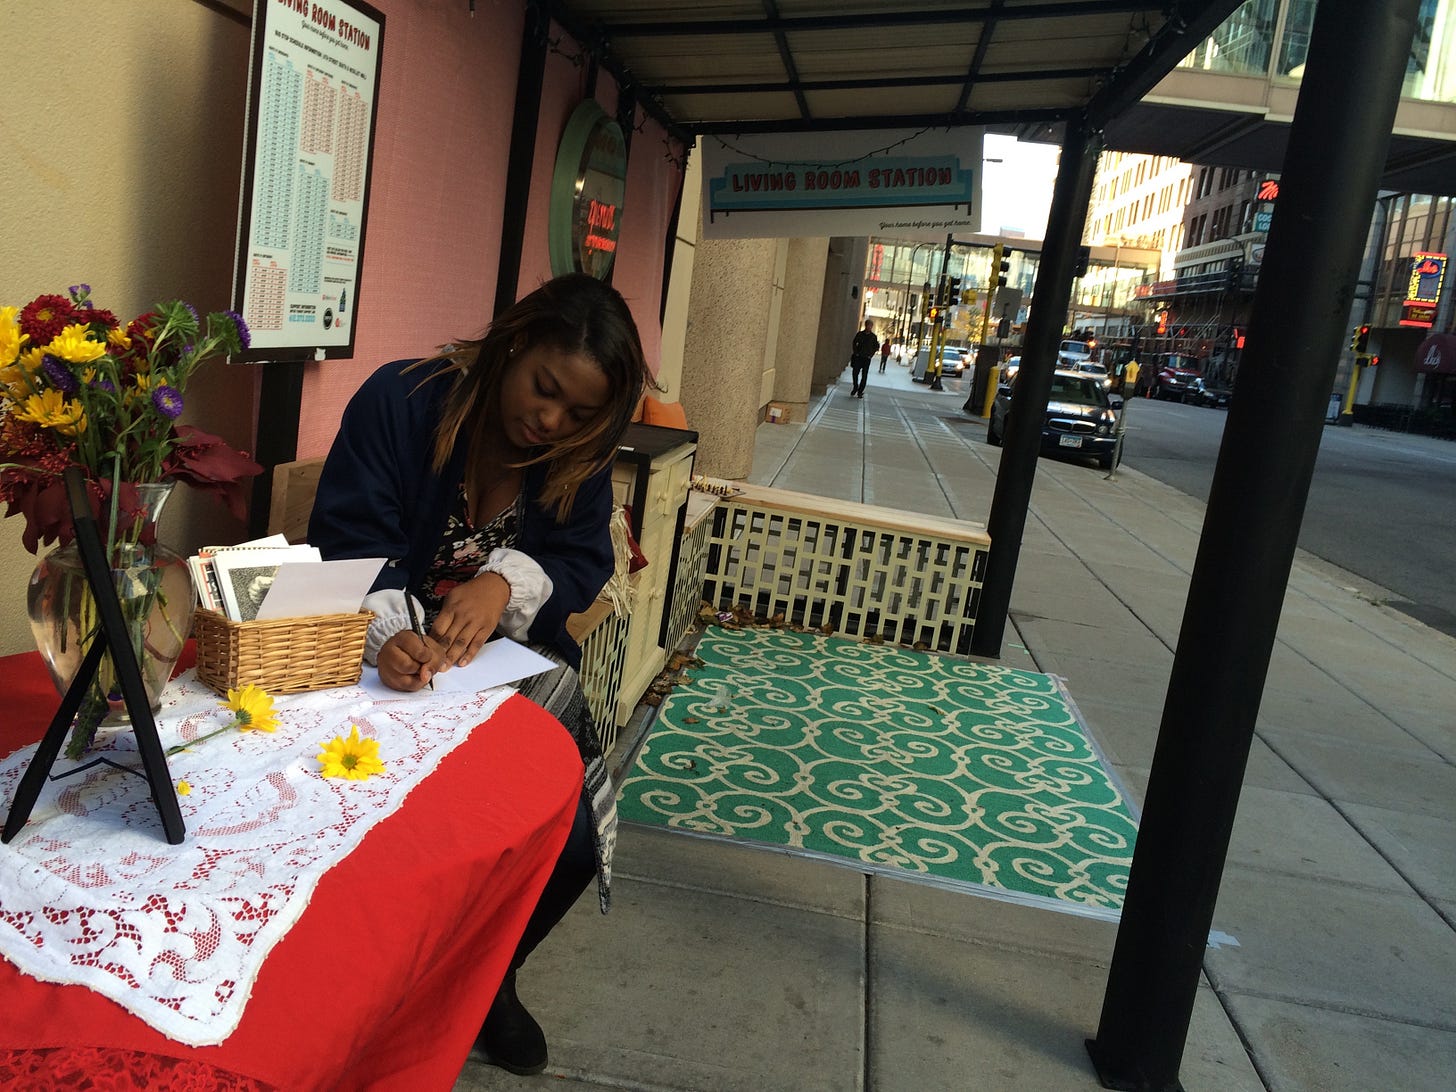
The City of Minneapolis asked us to increase awareness, access, and create positive experiences at their “Mobility Hubs,” to inform future planning for these new transit centers, and to build buy-in for a long-term mobility hub network. We created and installed “Living Room Station”: a comfortable and inviting space for users to wait for the bus and enjoy downtown. It stayed up for 30 days, and afterward, we learned from bus riders that:
86% of them felt Living Room Station made their experience in downtown better,
70% felt safer downtown thanks to Living Room Station, and
95% wanted to catch the bus thanks to Living Room Station.
Some riders even wrote unsolicited notes of gratitude and left them on-site for us! One such note said:
“I stop here with my 2-year-old daughter every morning. This used to be the WORST part of our daily commute. Sitting on the bus bench was always scary with a 2 year old and the vehicles driving by so closely… Now we feel warm, safe and invited here daily. This stop is the HIGHLIGHT of our daily commute, and the bus always seems to arrive too soon. Thank you so much for taking this step to improve our daily lives. We are truly grateful.”
We also interviewed numerous people who said they changed where they waited for the bus, going out of their way to use this pop-up station.
Both here and with the Capella Tower example, you can see the golden logic model at work. The spaces had improved and we could thus measure that more people were using them, and, subsequently, we were able to gather data that showed the changes made were in service of the stakeholders’ goals.
Ultimately, data strengthens both the practice and the perception of placemaking. It helps you refine your work, communicate its value, and expand its reach. While stories and feelings will always drive this field, data ensures those stories are heard and believed by the people who can help carry them forward.
Now that you’ve made it this far and have seen tangible improvements, what’s next? Repeat! We’ll talk more about that in the final installment of this series. Stay tuned.
